Apollo GraphQL, Request Logging with Pino


I love using pino for logging in NodeJS. It's lightweight and provides all the normal logging stuff you'd expect. It's verbose as hell, and you really need to be ingesting your logs somewhere, like DataDog.
Lately I've been tripped up on linking errors to the originating requests. We have a backend that's built with Apollo Server and the logging wasn't completely intuitive and tracing errors had been a chore.
Child Loggers
The code above produces the following:
{
  "level": 30,
  "time": 1617774346260,
  "pid": 204,
  "hostname": "768a207acb3c",
  "msg": "Hello, I'm the logger."
}
{
  "level": 30,
  "time": 1617774346262,
  "pid": 204,
  "hostname": "768a207acb3c",
  "requestId": "ckn712ql100005op787n68tha",
  "msg": "And I am the child, with a request id!!"
}
The second output includes the requestId. What this means is you can pass child as the logger into a request context and have the same requestId output each time.
Apollo Plugins
Apollo Server has a robust-enough plugin system that we can use for logging. Here's how I built ours:
const cuid = require('cuid');
const pino = require('pino')();

const apollo = new ApolloServer({
  schema,
  plugins: [
    {
      requestDidStart(ctx) {
        ctx.logger = pino.child({ requestId: cuid() });
        ctx.logger.info({
          operationName: ctx.request.operationName,
          query: ctx.request.query,
          variables: ctx.request.variables,
        });

        return {
          didEncounterErrors({ logger, errors }) {
            errors.forEach((error) => logger.warn(error));
          },
        };
      },
    },
  ],
});ctx.logger = pino.child({ requestId: cuid() });A plugin that taps into the requests needs to define requestDidStart and from there it can amend the GraphQLContext (ctx above) to have a child logger that includes our requestId. Since this requestDidStart happens at the beginning of all requests, we will get a new cuid() that gets outputted each time we use ctx.logger until the request ends.
ctx.logger.info({
	operationName: ctx.request.operationName,
	query: ctx.request.query,
	variables: ctx.request.variables,
});
Since pino uses a JSON output, we can just log objects, instead of strings. This lets us use them as facets in our logging platform. In this case, we're using some components of the GraphQL Request. This helps us debug our code so we know what query caused which errors.
Our particular app does not take inputs of sensitive variables, but if we did, we would want to consider scrubbing those variables before logging them.
return {
	didEncounterErrors({ logger, errors }) {
		errors.forEach((error) => logger.warn(error));
	},
};
An Apollo Server plugin can return an object with more functional hooks. We use didEncounterErrors which allows us to use our logger. Most of the errors we've encountered were misuses of our API so we set the log output to warn.
Local Development
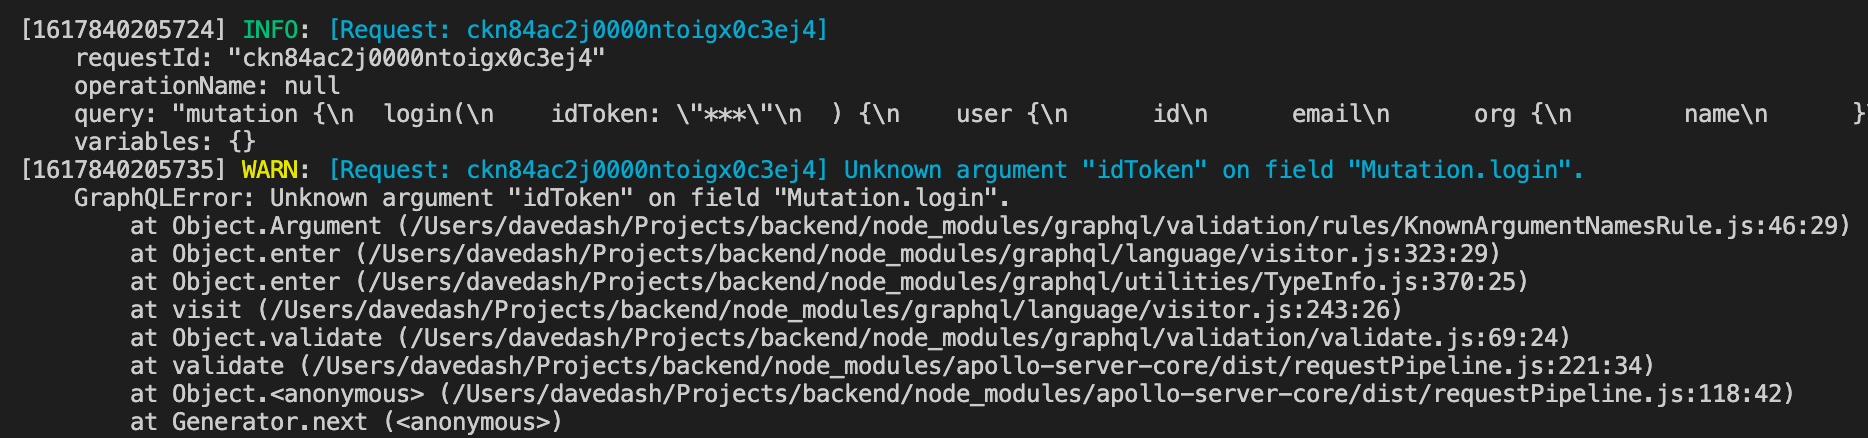
For local development we use pino-pretty to output our logs. We configure it using:
{
  "messageFormat": "[Request: {requestId}] {msg}",
  "ignore": "pid,hostname"
}
And that outputs our logs with the requestId prominently displayed.
As you build out your apps, try to think about how you can trace your errors faster. I love the ability to slice my logs by individual requests. It can help me figure out where things go wrong.
Further improvements to this can include:
- Including
userIds in the logs. - Including a
metricssummary at the end of the logs to store timing data. - Variable scrubbing (mentioned earlier).
Let me know your tricks to better logging and debugging of GraphQL or other tools.